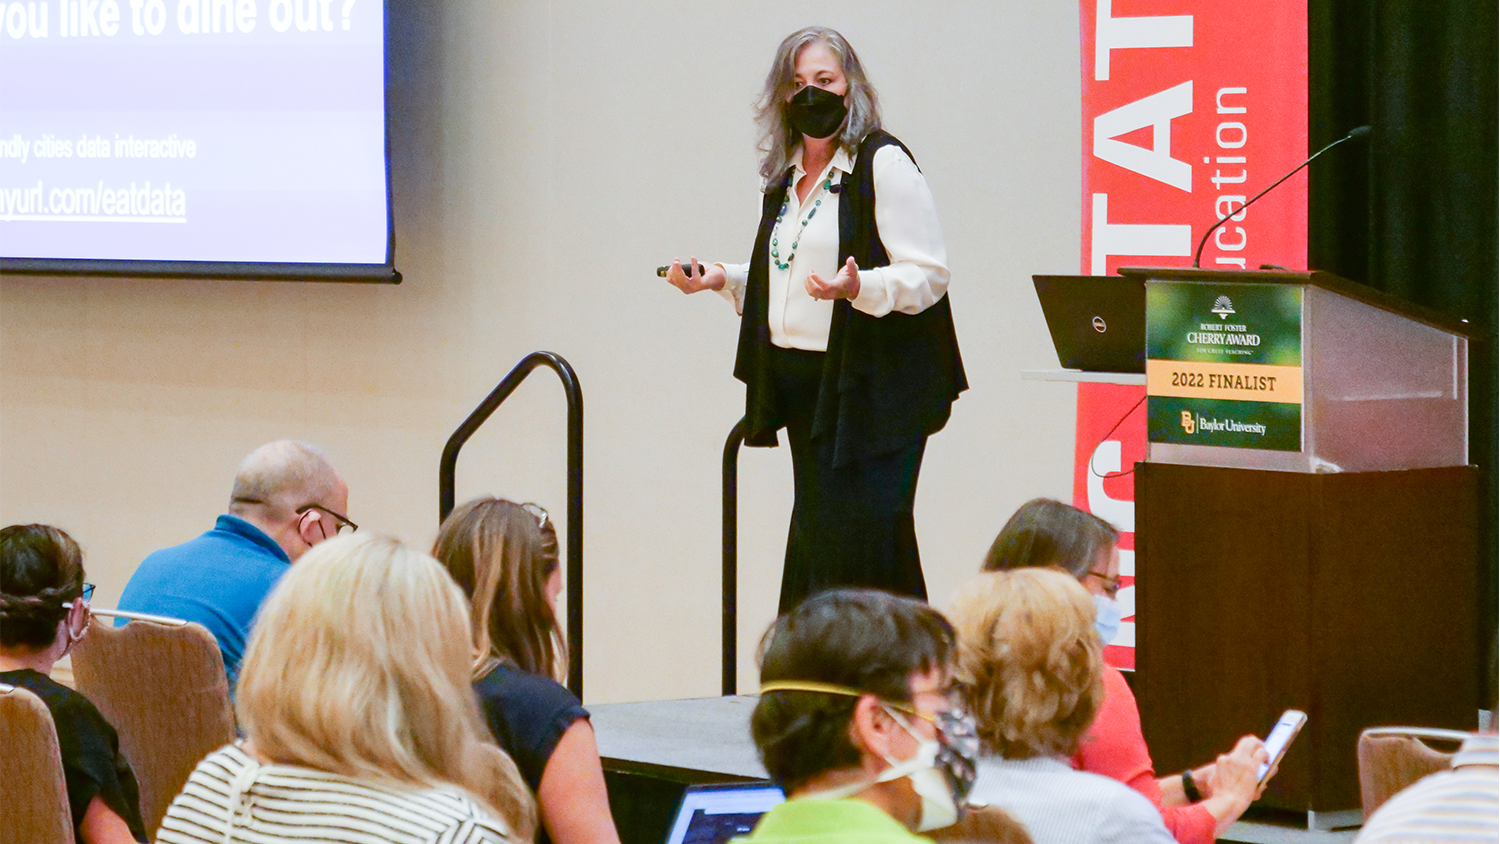
‘I Want The Folks in Our Society to Be Data Literate So That We Are Making Good Decisions Together for the Good of the World,’ Says Professor Hollylynne Lee During Cherry Award Lecture

What makes a roller coaster thrilling or scary? How do you find a unique restaurant when you’re planning to go out for dinner? Although seemingly unrelated, NC State College of Education Professor Hollylynne Lee, Ph.D., shared that both of these questions demonstrate the importance of understanding statistics and data science.
Lee is a professor of mathematics and statistics education, a senior faculty fellow with the college’s Friday Institute for Educational Innovation and one of three 2022 finalists for Baylor University’s highly prestigious Robert Foster Cherry Award for Great Teaching. During her Sept. 23 Cherry Award Lecture, entitled “Data Moves and Discourse: Design Principles for Strengthening Statistics Education,” she discussed the need to strengthen statistics education and the ways she has used her research to create learning opportunities for both students and teachers.
Through audience participation, Lee highlighted that understanding of data and statistics has far-reaching implications beyond the classroom, with people sharing that they’ve used data in a variety of scenarios in their own lives, from buying a car and negotiating salaries to deciding where to live and monitoring COVID case numbers.
“We need data literate citizens. I want my neighbors and the folks in our society to be data literate so that we are making good decisions together for the good of the world,” Lee said.
To produce those data literate citizens, Lee has devoted her career to helping create lessons that provide students with opportunities to access different mathematical and statistical ideas, keeping in mind the tools available to teachers, the questions that will guide their thinking and the ways that students might interact with the information and each other.
When engaging in purposeful design to create exceptional learning opportunities for students, Lee said that the two most critical aspects are data moves — the actions taken to produce, structure, represent, model, enhance or extend data — and discourse.
“These two things coming together are really what I care a lot about and use in instructional design related to statistics education,” she said.
When engaging students in data analysis, Lee said it’s important the data they are looking at is real. Many textbooks have fake datasets that look realistic, but to truly understand data, the sets need to be large, multivariate and sometimes even messy, she said.
With engaging context rooted in reality, educators can then use appropriate tools to facilitate data moves and visualizations to help students uncover links between data representations.
Using data dashboards related to restaurants in the Raleigh and Durham areas and roller coasters at theme parks in several nearby states, Lee demonstrated how the inclusion of multiple variables into various data analyses can help students draw conclusions about data points.
For example, in a video recorded while Lee was working with students in a middle school classroom, she showed how the addition of data related to the material a roller coaster was made of to a scatter plot that already showed data related to speed and height helped students come to the conclusion that wooden roller coasters tend to have shorter drops and slower speeds compared to steel roller coasters.
Although it may seem counterintuitive to the traditional idea of starting off simple when introducing new ideas, the video demonstrates that more complex data sets can actually help enhance student understanding.
“We do not live in a univariable or bivariable world. We live in a multivariable world, and our students are very adept at reasoning that way if we give them the opportunity,” Lee said. “We know from a lot of research that special cases in data can help students make sense of the aggregate. Instead of explaining what I wanted [the students] to see, I made the graph more complex. I added a third variable so that it could contextualize something about those roller coasters for the students, and it worked.”
To bring data lessons into classrooms for students, Lee noted it’s important for pre-service and practicing teachers to have professional development opportunities surrounding statistics, as many did not have opportunities to learn about the subject in their own K-12 careers.
She discussed how she developed courses for the College of Education that ultimately attracted graduate students from across multiple colleges within NC State University, and how she ultimately applied her data course design principles to four online professional learning courses offered through the Friday Institute for Educational Innovation that have reached more than 6,000 educators in all 50 states and more than 100 countries.
Her Enhancing Statistics Teacher Education with E-Modules ESTEEM project, which began in 2016, created more than 40 hours of multimedia statistics modules for university instructors to use as-needed in courses for pre-service, secondary math teachers. Her current National Science Foundation-funded InSTEP project builds on seven dimensions of teaching statistics and data science — data and statistical practices, central statistical ideas, augmentation, tasks, assessment, data and technology — that have been proven to make for good learning environments.
Lee noted that, throughout her career, her most joyful moments have always been working with students and teachers. From watching teachers reflect on their practice and work together to improve their pedagogy to engaging with students as they dig into data and begin to make sense of it.
As she encouraged educators and future educators to think about how they will approach different problems in education and daily lives in relation to learning and teaching statistics, she reminded them to have faith in their students’ abilities and to be open to learning right alongside them.
“Teaching with data can be scary because you do have to say that you’ll be a learner along with them. You’re there thinking really hard in the moment about what that next question might be. That can be scary — or thrilling,” Lee said.
- Categories:


